
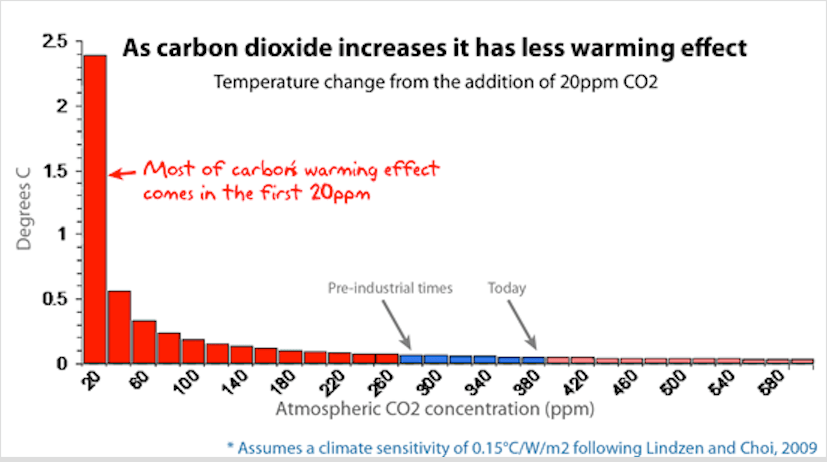
We are told that increasing concentrations of Carbon Dioxide (CO2) in the atmosphere will lead to ever increasing global temperatures. The United Nations’ Secretary General warns that we have reached the stage of ‘global boiling’ and we are at a ‘tipping point’ where temperatures will accelerate causing floods, droughts, famines and pestilence. None of this is true because the ability of CO2 molecules to slow down the escape of heat to space becomes saturated at modest concentrations. The chart below looks complicated but the description below it explains it well.

This next chart shows the same phenomenon as above but in a less complicated visual format. This is important to understand because increasing CO2 levels are very beneficial for plants. It is totally wrong to refer to caron dioxide as a ‘pollutant’. It is the molecule of life; without it there can be no life on this planet.
But we are constantly shown graphs of rising temperatures aligned with rising CO2 levels. And we are told the global average temperature has risen by 1.5 degrees since the late 1800s. It is very difficult to know what the global average was over 100 years ago because there were very few accurate weather stations anywhere in the world other than North America and Europe. Previous global temperatures are an estimate at best and it makes more sense to look at the changes in those locations which have extensive thermometer records.
If there is a crisis of higher and higher temperatures, it makes sense to examine the maximum temperatures over a long period of time, rather than the average of all temperatures. The chart below shows the maximum summer temperatures across the US Corn Belt, which covers the mid-western states of Indiana, Illinois, Iowa, Missouri, eastern Nebraska, and eastern Kansas. The highest temperatures occurred during the 1930s. There is clearly no relationship between maximum temperatures and CO2 concentrations and there is no new extreme of maximum temperatures.

We are told that climate change is causing an increase in dangerous fires, but the evidence says the exact opposite. Total area of land burned by wild fires in the USA has decreased considerably since the 1930s.

The climate change alarmists have been predicting a wide range of disastrous consequences for many decades. These predictions of doom have a 100 per cent record – every single one of them has failed to materialise. To keep people believing in the ‘Climate Crisis’ the authorities have resorted to some very dirty tricks. The graphic below shows the USA temperature record from 1880 to 1999 as published by NASA in 1999 (grey graph) and the exact same thing as published by NASA in 2019 (green graph) Except it is not the same; the hottest temperatures of the past have been ‘adjusted’ downwards and recent temperatures have been ‘adjusted’ upwards in the 2019 version. NASA and the rest of the climate change cult need to Stop Feeding Us Lies.

[This graphic is courtesy of Tony Heller at realclimatescience.com, where you can find many more examples of changing the past to fit the climate agenda.]